Some Graphviz examples that demonstrate custom layout and formatting techniques.
Subgraphs and ranking
This example shows how to use subgraph to control layout.
digraph ranked {
    subgraph cluster_A {
        a1 -> a2
        a2 -> a3

        {rank=same;a1;a2;a3}
    }

    subgraph cluster_B {
        a3 -> b1
        b1 -> b2
        b2 -> b3

        {rank=same;b1;b2;b3}
    }

    begin -> a1
}
HTML formatted nodes
This example shows how to use HTML-like formatting.
digraph html {
    rankdir=LR
    a [shape=plaintext,label=<
      <table cellspacing="4">
        <tr>
          <td port="a1">column 1</td>
          <td>column 2</td>
        </tr>
        <tr>
          <td colspan="2" port="a2">colspan</td>
        </tr>
      </table>
    >]
    b [shape=plaintext,label=<
      <table border="0" cellborder="1" cellspacing="2">
        <tr>
          <td rowspan="3" port="b2">left</td>
          <td>top</td>
          <td rowspan="3">right</td>
        </tr>
        <tr>
          <td port="b1">center</td>
        </tr>
        <tr>
          <td>bottom</td>
        </tr>
      </table>
    >]

    a:a1 -> b:b1
    a:a2 -> b:b2
}
Network
This example shows how to layout a network diagram using custom node images.
graph network {
    nodesep=1
    ranksep=1
    edge [fontsize=11]

    subgraph wanedge {
        r1 [shape=none,label="",image="router.svg"]
        r2 [shape=none,label="",image="router.svg"]
    }

    subgraph core {
        c1 [shape=none,label="",image="router.svg"]
        c2 [shape=none,label="",image="router.svg"]

        {rank=same;c1;c2}
    }

    r1 -- c1 [headlabel="eth0/0" taillabel="eth1/0"]
    r2 -- c1 [headlabel="eth0/1" taillabel="eth1/0"]
    c1 -- c2 [headlabel="eth1/0" taillabel="eth1/0"]
}
Records
THis example uses the record shape for the nodes.
digraph Records {
    node [ shape = "record" ]

    one [ label = "{RecordOne|right\r|centre|left\l}" ]
    two [ label = "{RecordTwo|row|row|row|row}" ]
    one -> two
}
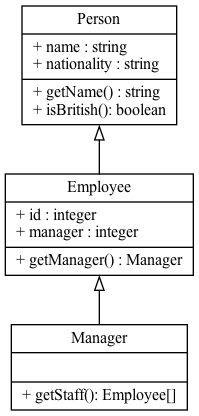
UML
This example also uses the record shape to draw UML-like class nodes.
digraph uml {
    node [ fontsize = 12 shape = "record" ]
    edge [ arrowtail = "empty" ]

    person [
    label = "{Person|+ name : string\l+ nationality : string\l|+ getName() : string\l+ isBritish(): boolean\l}"
    ]

    employee [
    label = "{Employee|+ id : integer\l+ manager : integer\l|+ getManager() : Manager\l}"
    ]

    manager [
    label = "{Manager|\l|+ getStaff(): Employee[]\l}"
    ]

    person -> employee [dir=back]
    employee -> manager [dir=back]
}
Shape demo
This example demonstrates a variety of the available polygon shapes.
digraph shapes {
    a [shape=box]
    b [shape=polygon,sides=6]
    c [shape=triangle]
    d [shape=invtriangle]
    e [shape=polygon,sides=4,skew=.5]
    f [shape=polygon,sides=4,distortion=.5]
    g [shape=diamond]
    h [shape=Mdiamond]
    i [shape=Msquare]
    a -> b
    a -> c
    a -> d
    a -> e
    a -> f
    a -> g
    a -> h
    a -> i
}